Run Elastic Kibana Locally
To use elastic-kibana locally you need to have docker installed in your system and then create a folder (for example elk) and then a file with name docker-compose.yml and put following docker-compose yaml in it.
version: '2.2'
services:
  es01:
    image: docker.elastic.co/elasticsearch/elasticsearch:7.17.5
    container_name: es01
    environment:
      - "discovery.type=single-node"
      - "ES_JAVA_OPTS=-Xms512m -Xmx2048m"
      - "ELASTIC_USERNAME=test-username"
    volumes:
      - data01:/c/elk/data
    ports:
      - 9200:9200
    networks:
      - elastic

  kibana:
    image: docker.elastic.co/kibana/kibana:7.17.5
    environment:
      ELASTICSEARCH_HOSTS: '["http://es01:9200"]'
    volumes:
      - ./kibana.yml:/c/elk/data/kibana.yml
    ports:
      - 5601:5601
    networks:
      - elastic
    depends_on:
      - es01
volumes:
  data01:
    driver: local

networks:
  elastic:
    driver: bridge
Then create a file with name kibana.yml on the same root and put following commands inside it.
##  To allow connections from remote users, set this parameter to a non-loopback address.
server.host: "0.0.0.0"
##  The URLs of the Elasticsearch instances to use for all your queries.
elasticsearch.hosts: ["http://elasticsearch:9200"]
##  If your Elasticsearch is protected with basic authentication, these settings provide
##  the username and password that the Kibana server uses to perform maintenance on the Kibana
##  index at startup. Your Kibana users still need to authenticate with Elasticsearch, which
##  is proxied through the Kibana server.
elasticsearch.username: "elastic"
elasticsearch.password: "L0f0t3n!"
then go to the folder and open powershell there and then run following command and wait to run completely.
docker compose up -d
Then go the http://localhost:5601/ address (maybe you need to wait 2 minutes to both elastic and kibana run completely)
Now you need to do some wiring ups ;)
- Go to discover
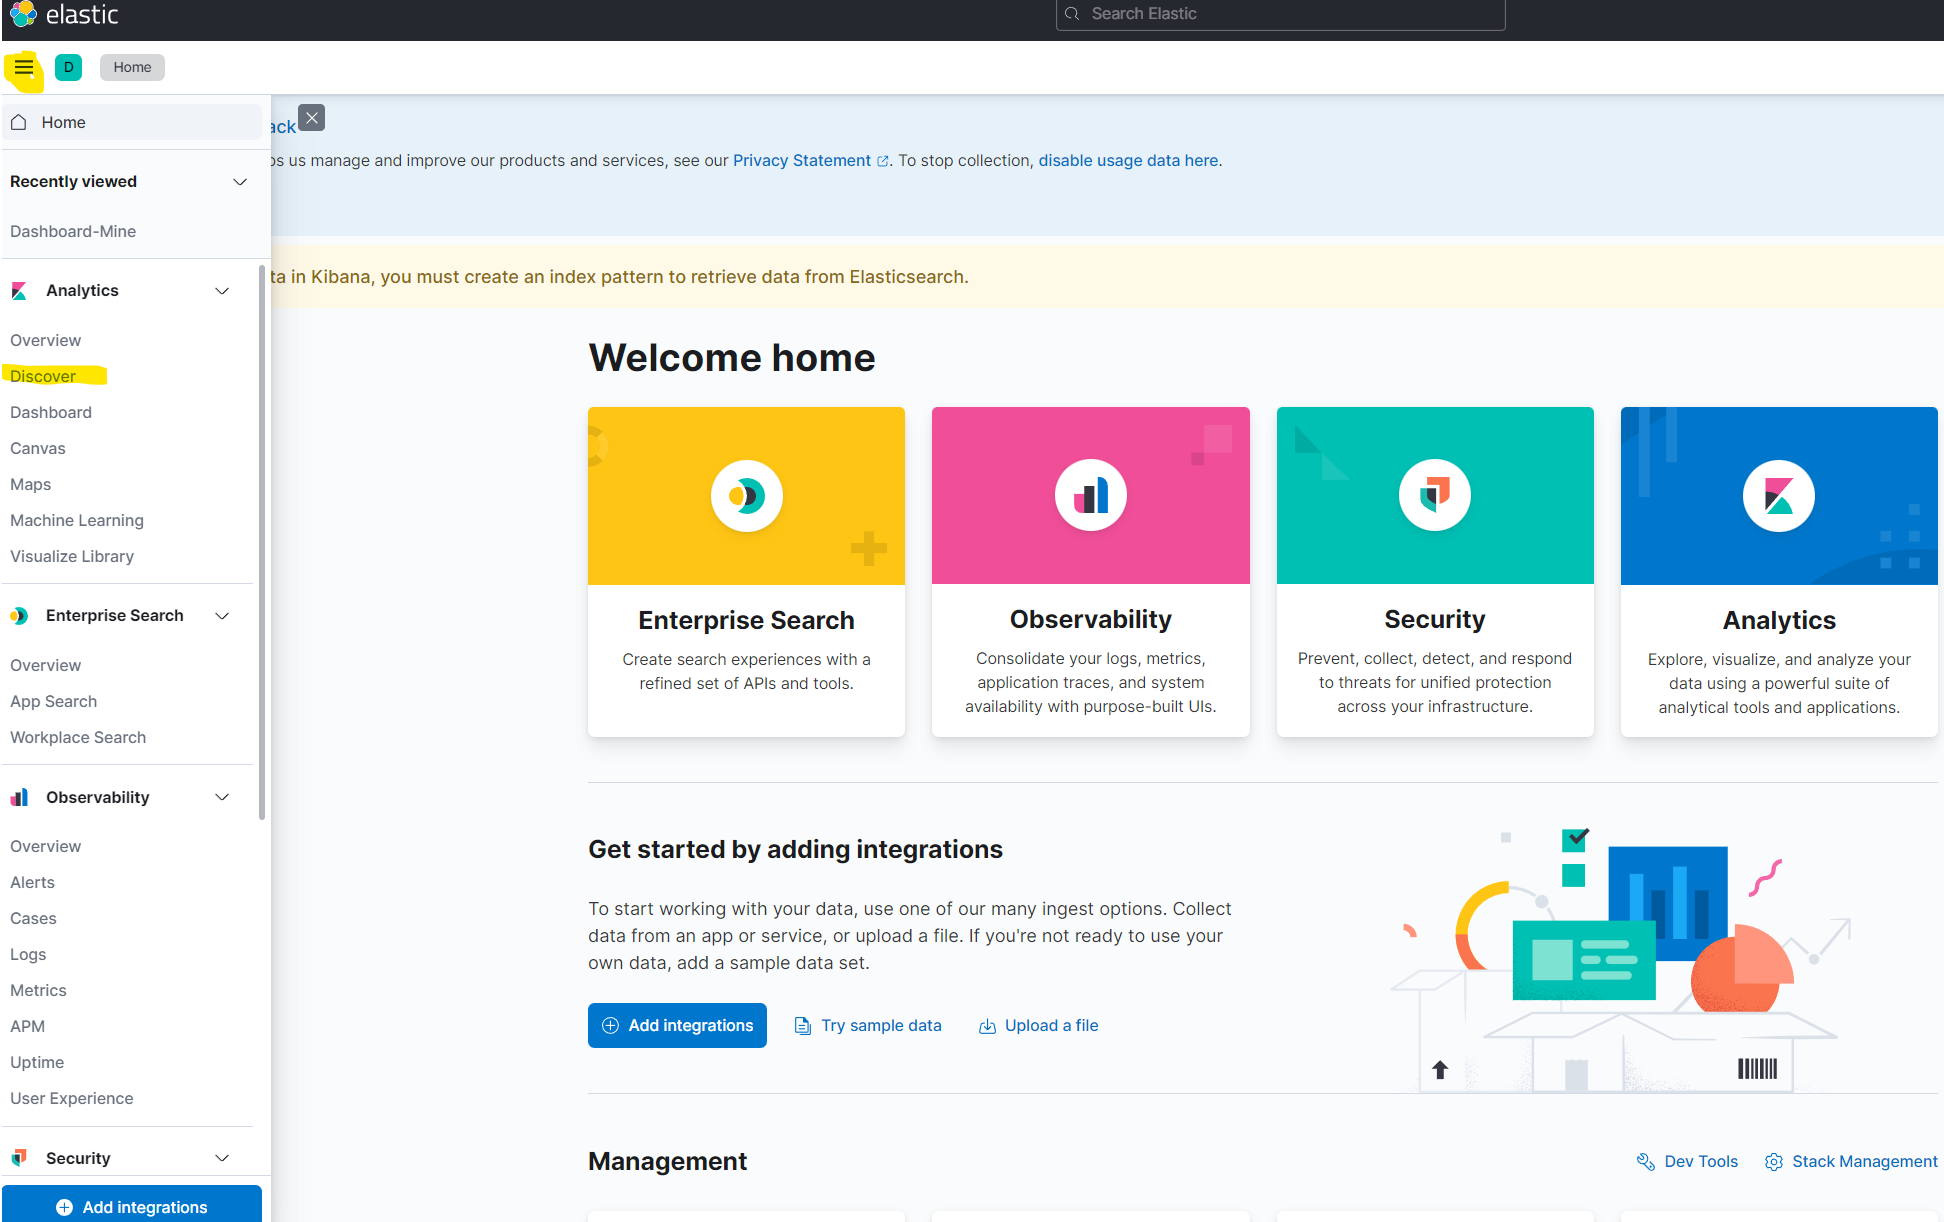
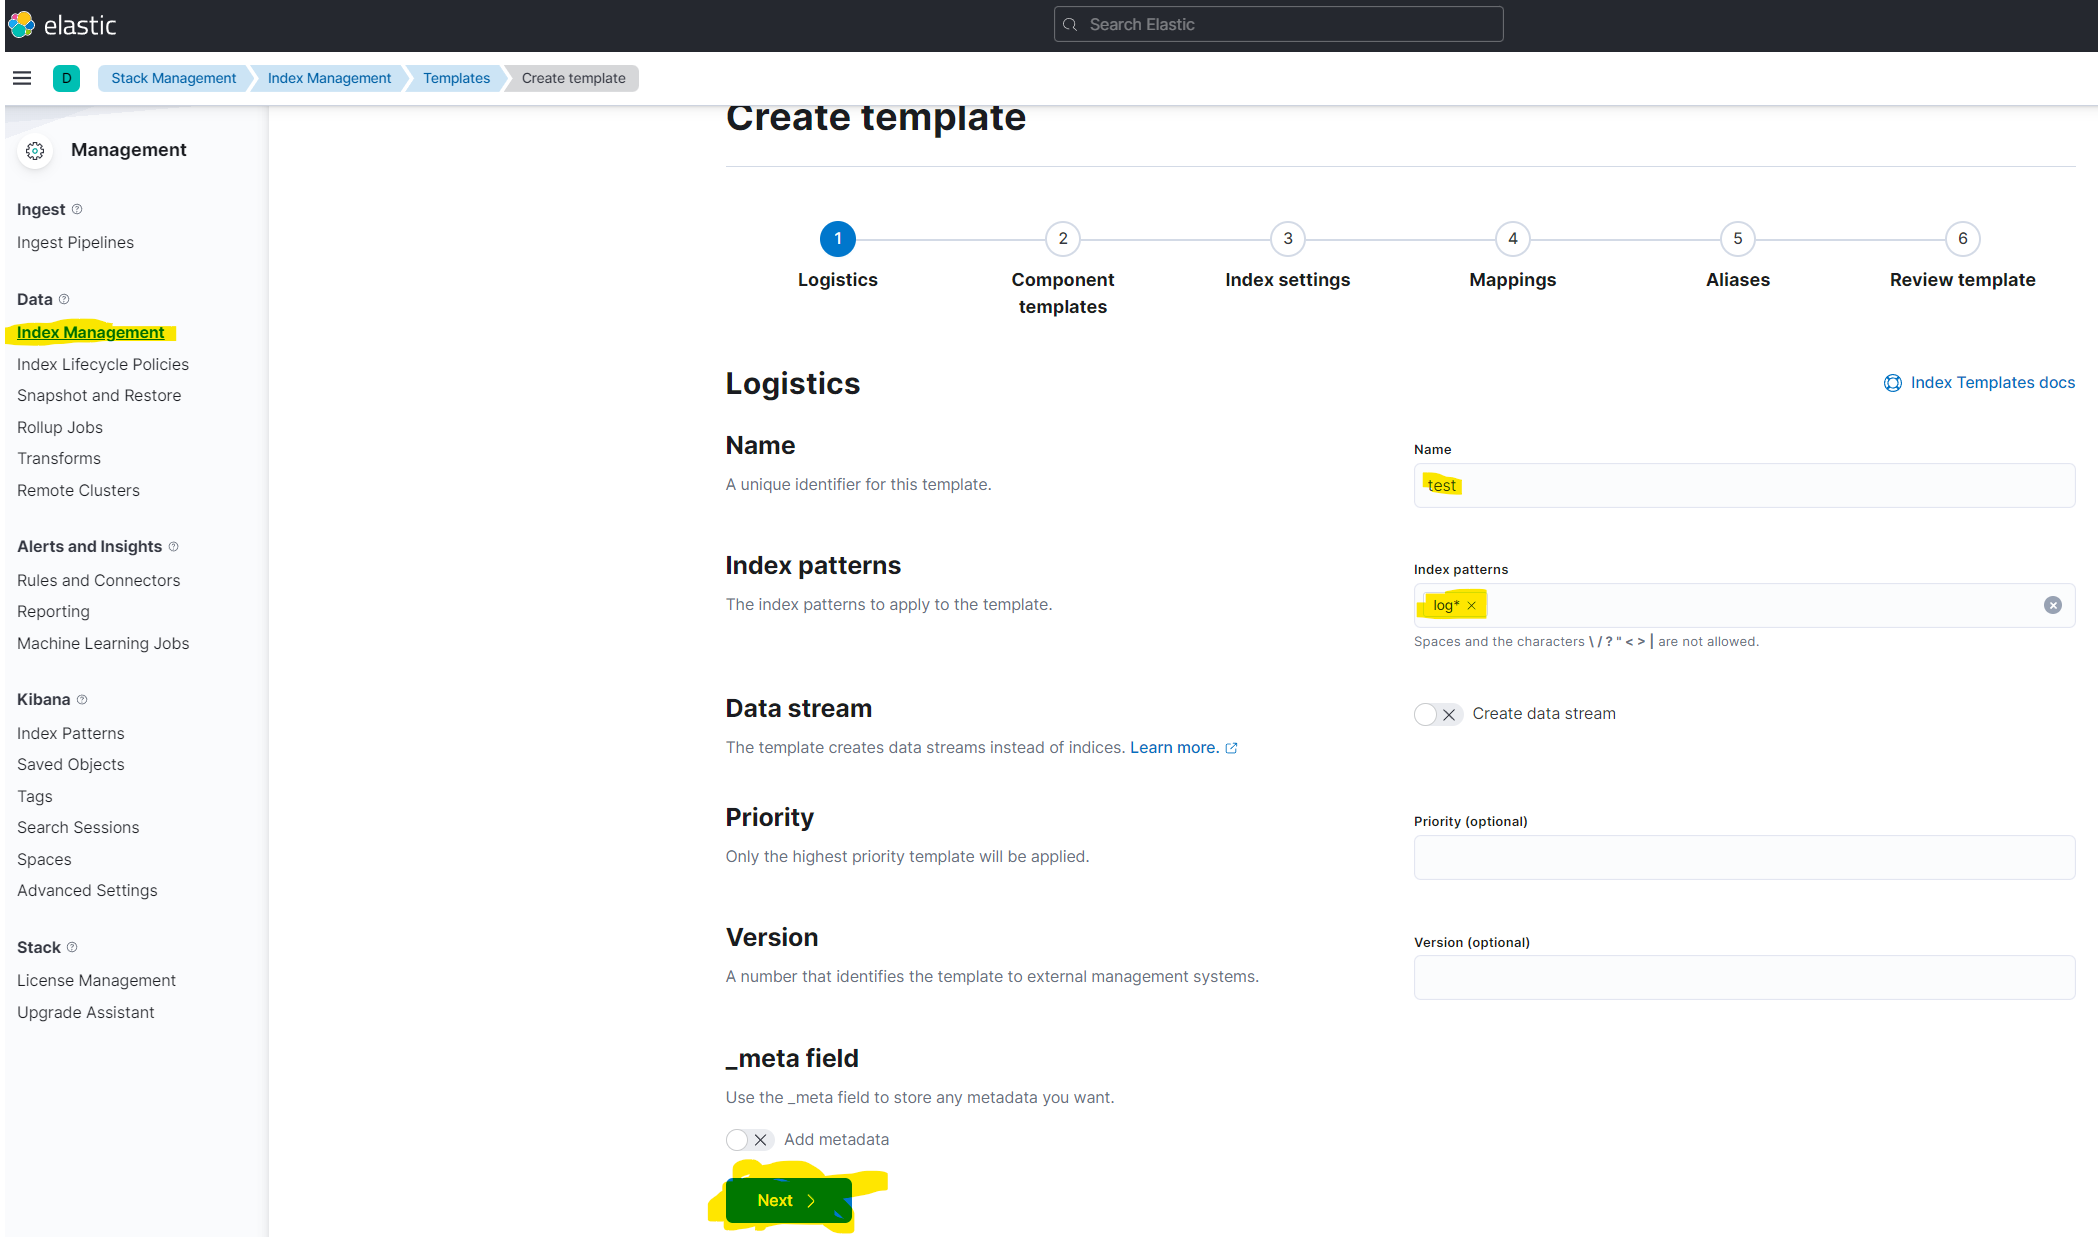
- Then go to the Index Management and then Create Template and there fill the form with provided information which you see in the following image and then press next button until template being created.
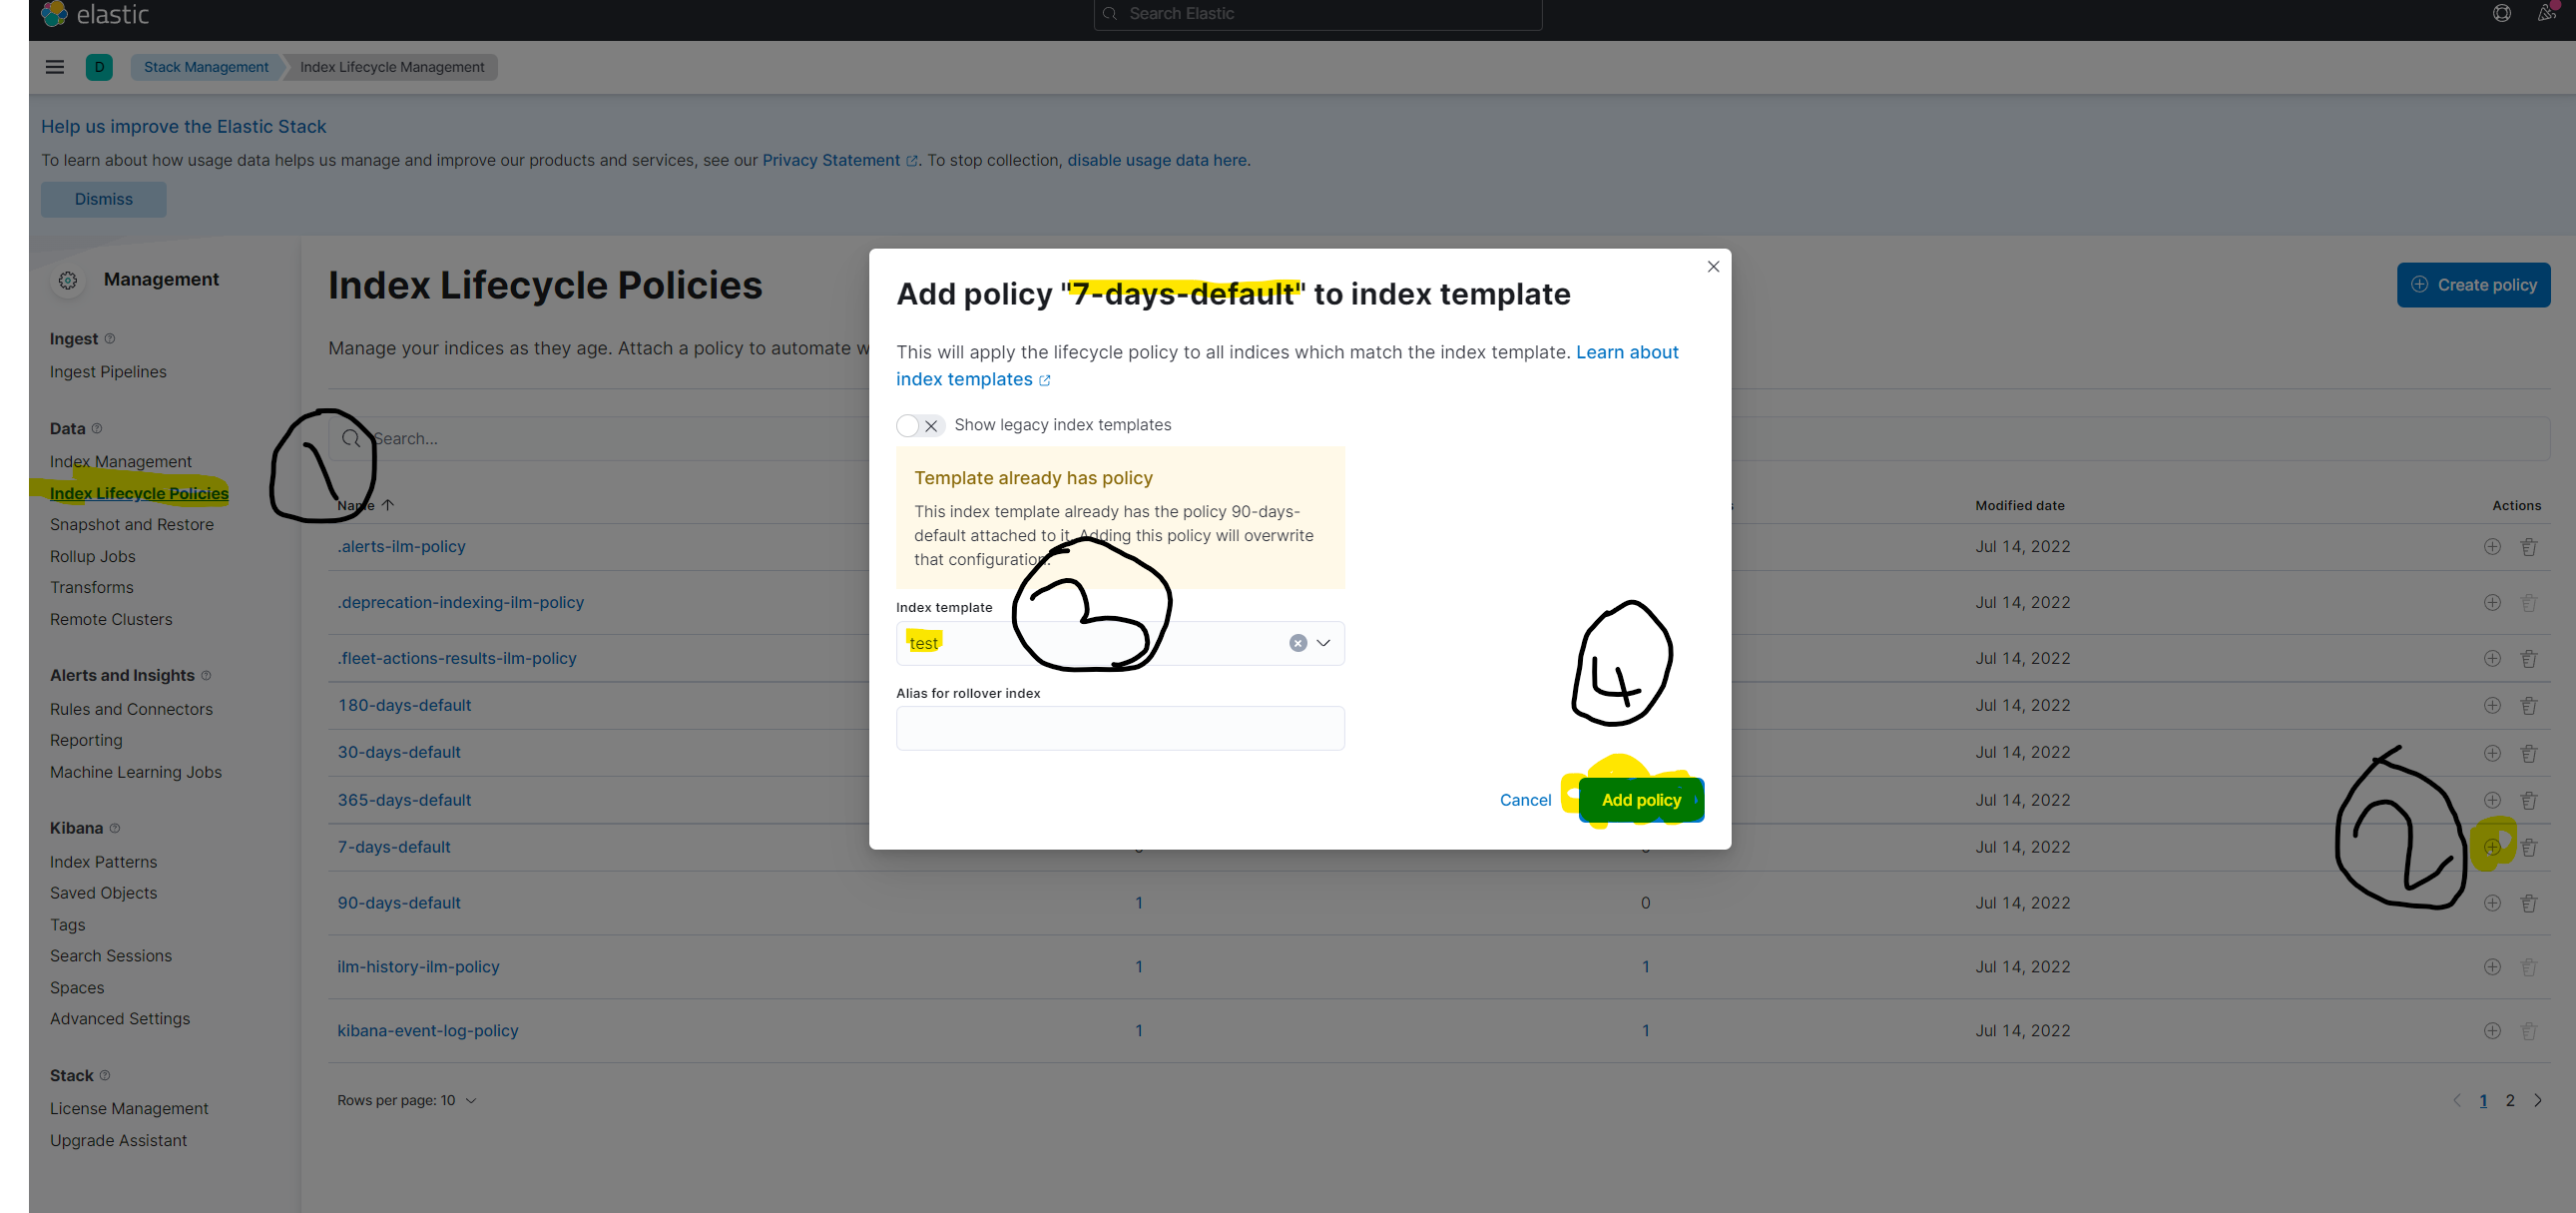
- Then go to the Index Lifecycle Policies and manage your index life policy like the following image
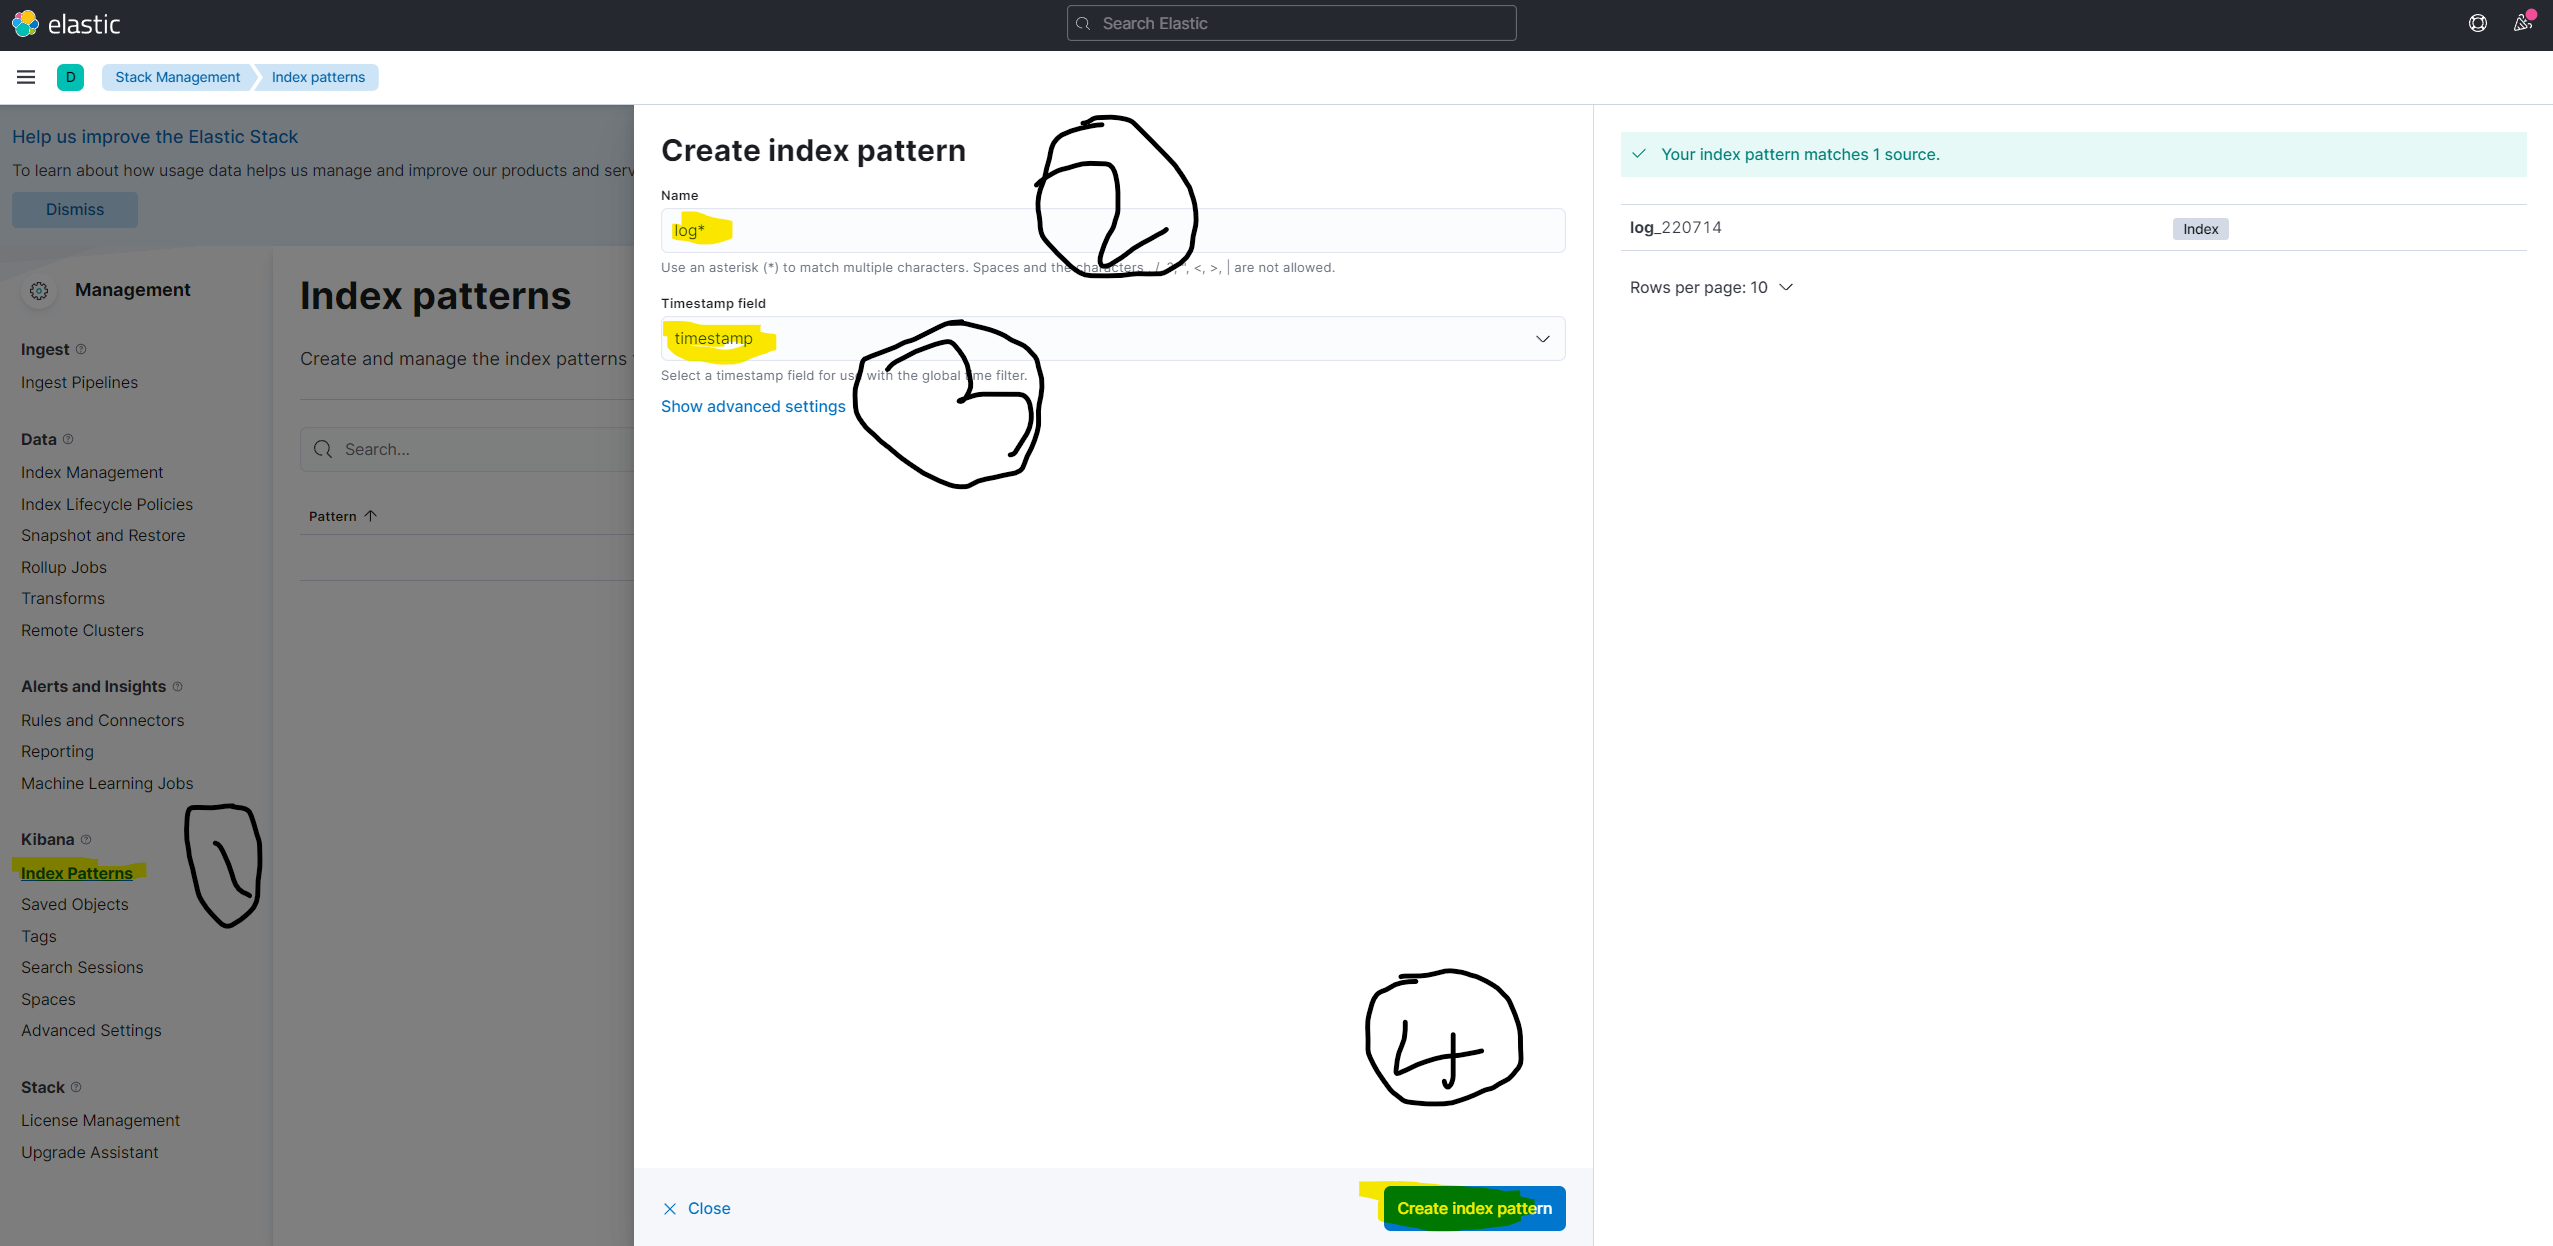
- Then go to one of your projects and run
secret.ps1and run some integration tests to elastic get some data then go to Index Patterns and follow the image's steps to create index pattern
- Then go to discover again and you will see your log data there
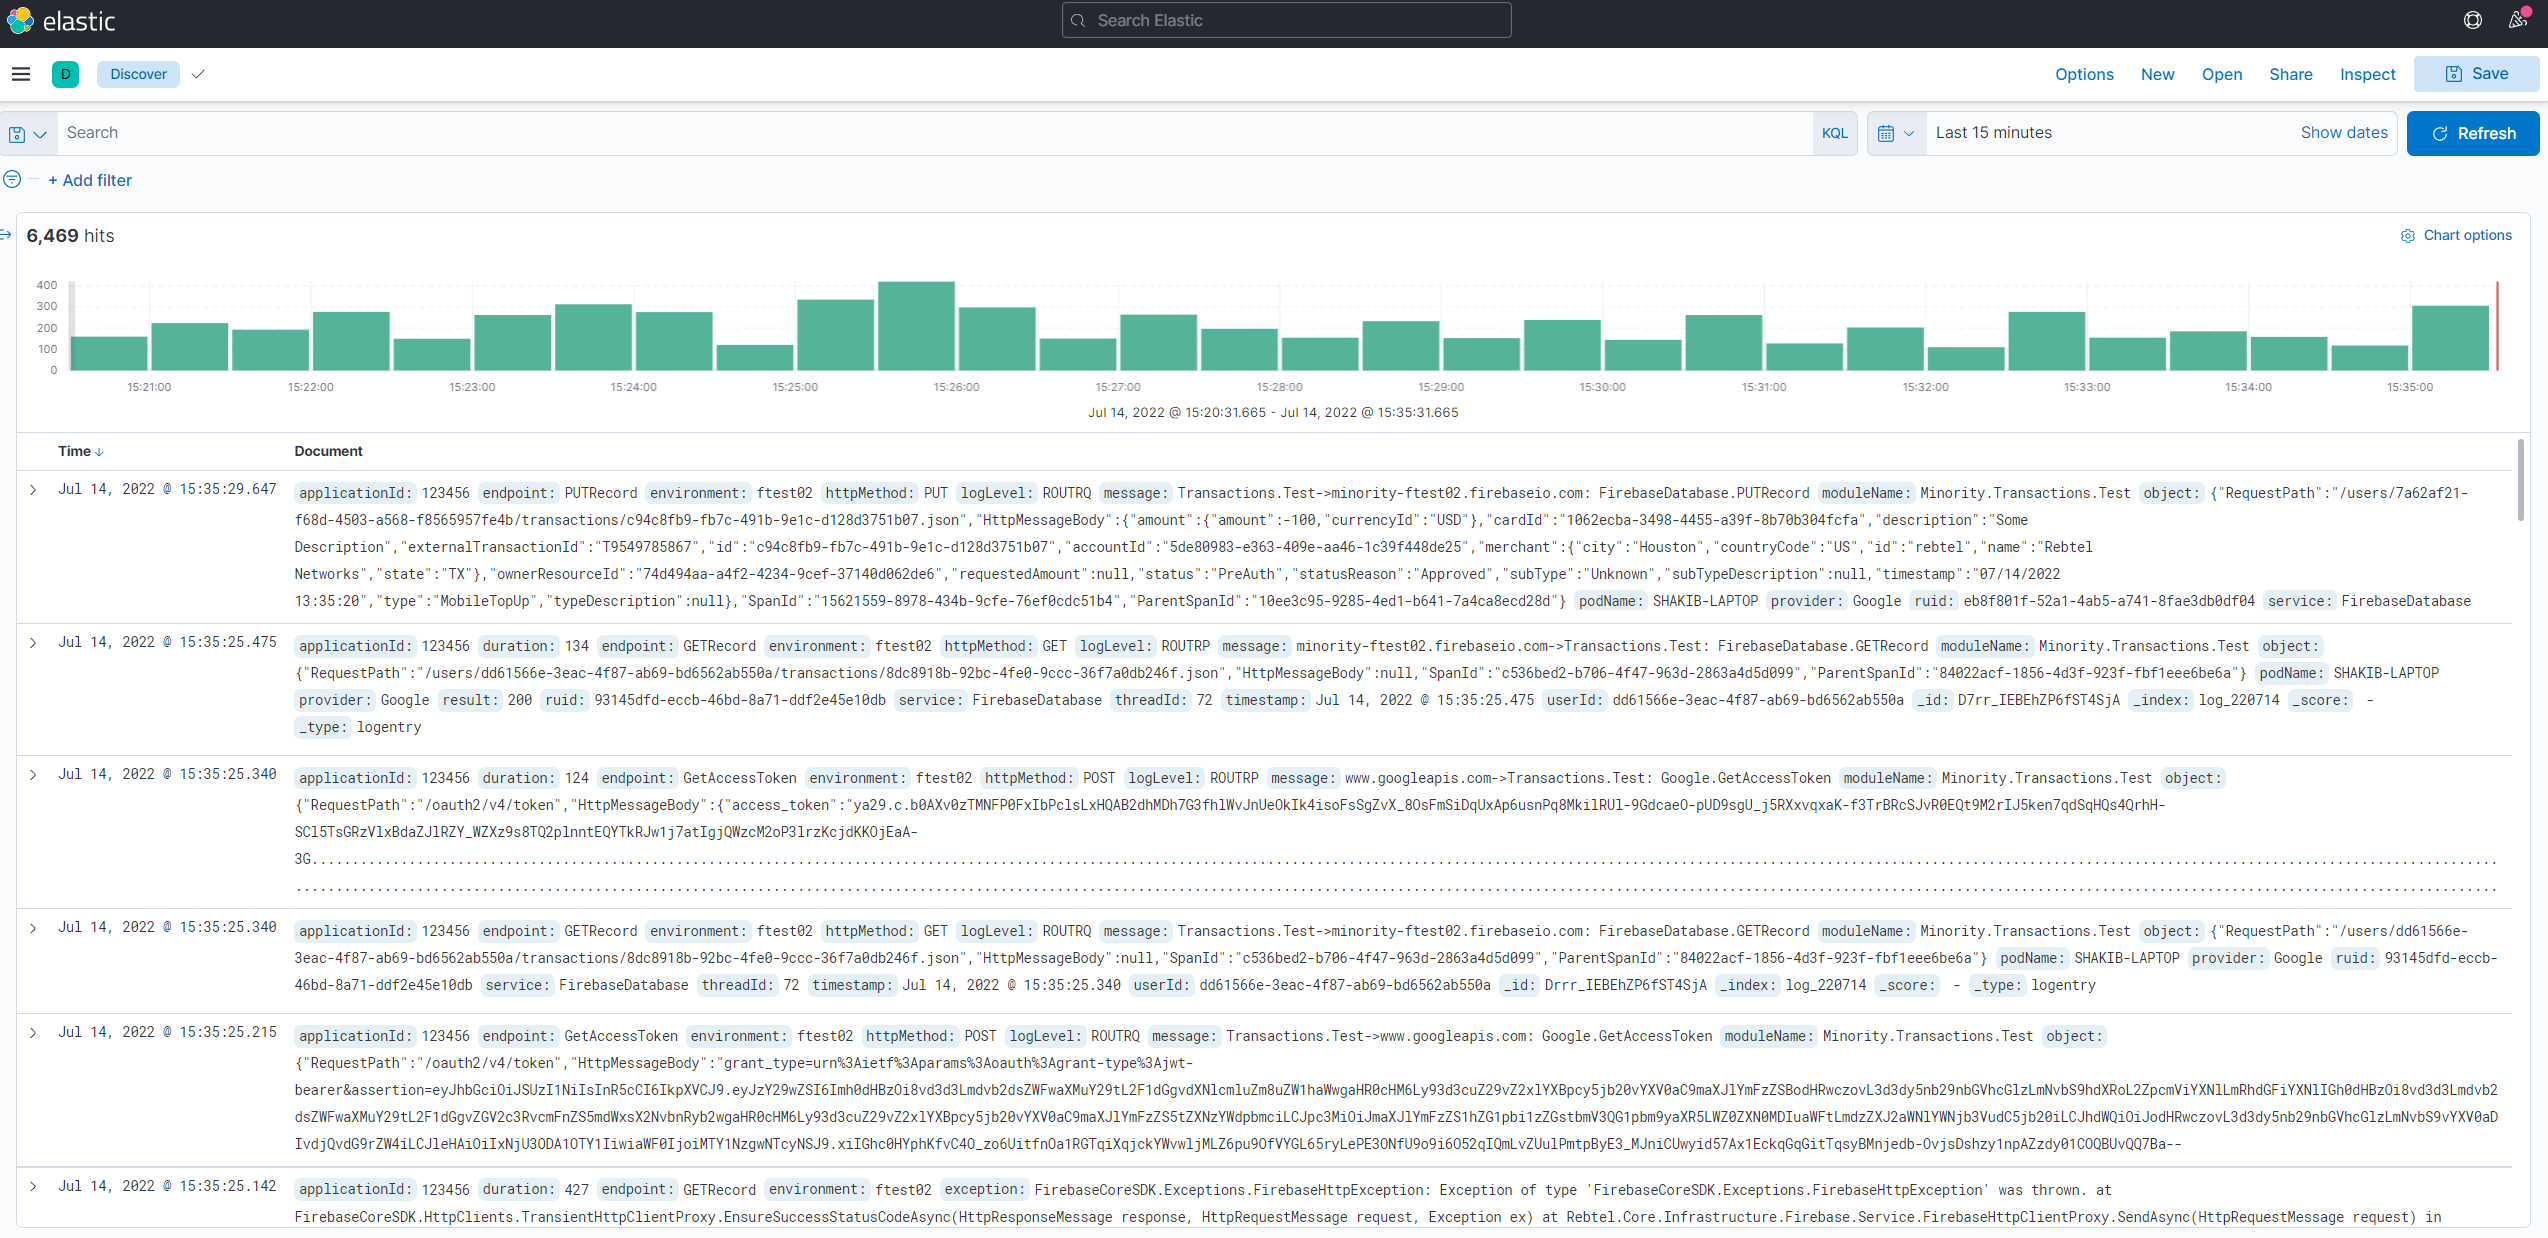
Done!