Metrics-(DataDog)
Overview
Backend publishes metrics using the OpenTelemetry SDK, which sends these to a Datadog agent that runs in K8s (one on each node). The Datadog agent will then forward the metrics to Datadog.
The metrics can be divided into a couple of groups:
- Metrics collected by the Datadog agent: The datadog agent collects a lot of metrics about cpu usage, disk space etc. in the kubernetes cluster.
- Metrics collected from Azure: DataDog ingests data from Azure (more or less the same metrics as show under Metrics in the Azure Portal).
- Custom metrics sent from C# code: Metrics sent from our services. See below for details.
Custom Metrics
Area/service code should not use the OpenTelemetry SDK directly, instead use the wrappers we have in the Platform code.
The platform code will also automatically publish a number of application metrics when other platform libraries are used (i.e. for REST, Events etc.). These are published as:
minority.response.count: Counts the number of requests, events published etc. More or less the same as the various log categories we use (DB, EOUT etc.).minority.error.count: Counts the number of errors.minority.latency: Similar tominority.response.count, but fewer tags but can contain not only the count but also latency (avg, p95 etc.)minority.<eventname>: Count the number of times this event has been published. (Note that the raw count is available in minority.response.count as well, however, this metric contains more/other additional tags/data). These metrics can also count/measure other data, by usage of KPI attributes on specific fields on the event class.
Metric types:
Datadog documentation here.
Histogram / Distributions
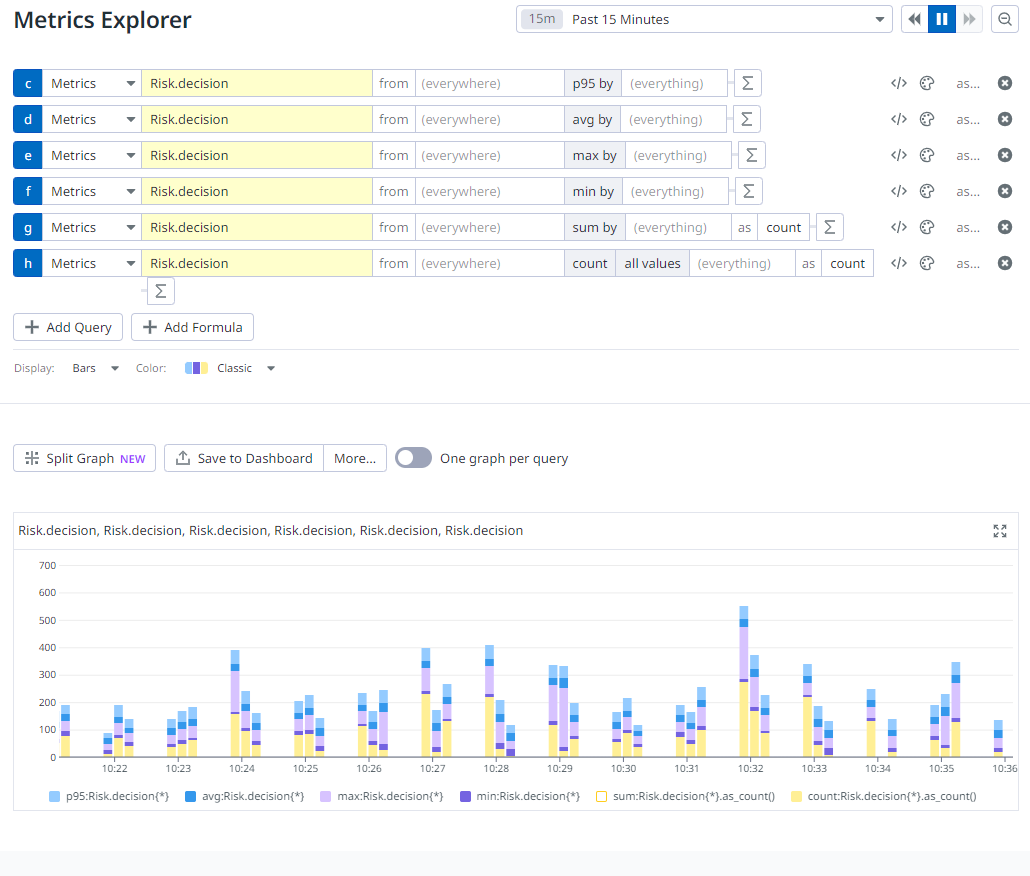
Any time we send a Histogram metric, it's recorded in Datadog as a Distribution. It can be graphed in the following way, note that not all possible ways are listed (here using the Risk.decision metric):
p95:Risk.decision{*}The p95 (95 percentile) of the value sent. (requires percentile:on)avg:Risk.decision{*}Average of the value sent.max:Risk.decision{*}Max value of the value sentmin:Risk.decision{*}Min value of the value sentsum:Risk.decision{*}.as_count()Sum value of the value sent (often not very useful)count:Risk.decision{*}.as_count()Count of values sent (risk decisions made)
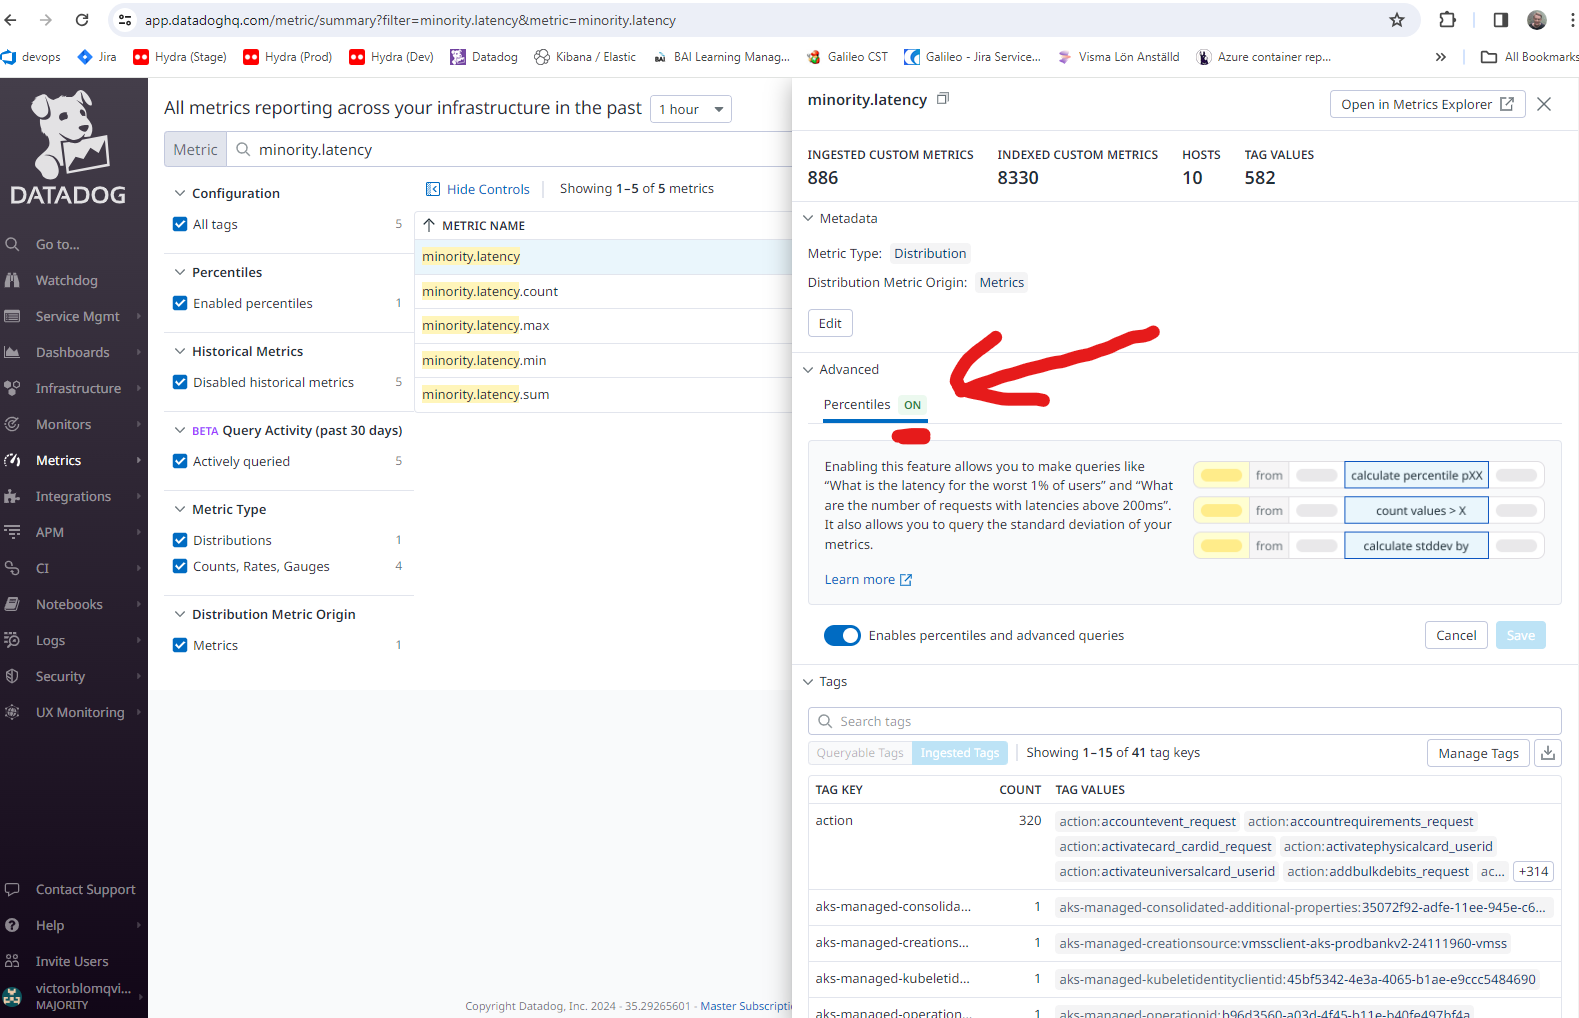
By default, the distribution will only include count, max, min and avg values, but it is possible to include percentiles like p99 or median in the Datadog UI. Note that enabling this increases our cost, only enable when it is used: